A new signal in the same test.
Gain real-time insight from every test run to understand what is working, identify what is not and refine your next experiment faster.
Capture the event, not just the outcome.
Every acoustic emission provides a new data point on physical changes occurring inside the cell. Pair acoustic and electrochemical measurements to investigate mechanisms, compare materials and test hypotheses with fewer iterations.
SEI layer behaviour
Monitor acoustic activity during SEI formation to identify passivation completion, flag abnormal behaviour and optimise formation protocols.
Electrolyte reactions
Reveal when electrolyte-driven processes and gas evolution occur, helping you compare additives and optimise formation conditions in real time.
Electrode changes
Observe acoustic signatures associated with structural changes, including cracking and degradation, as they develop during formation and cycling.
Fits the fixture you already use.
We fit a passive sensor against the cell in your fixture, on the bench or inside a cycler or chamber, and connect it to the acquisition unit. Where the fixture needs adapting to keep the sensor in steady contact, we design that with you.
See what makes a cell emit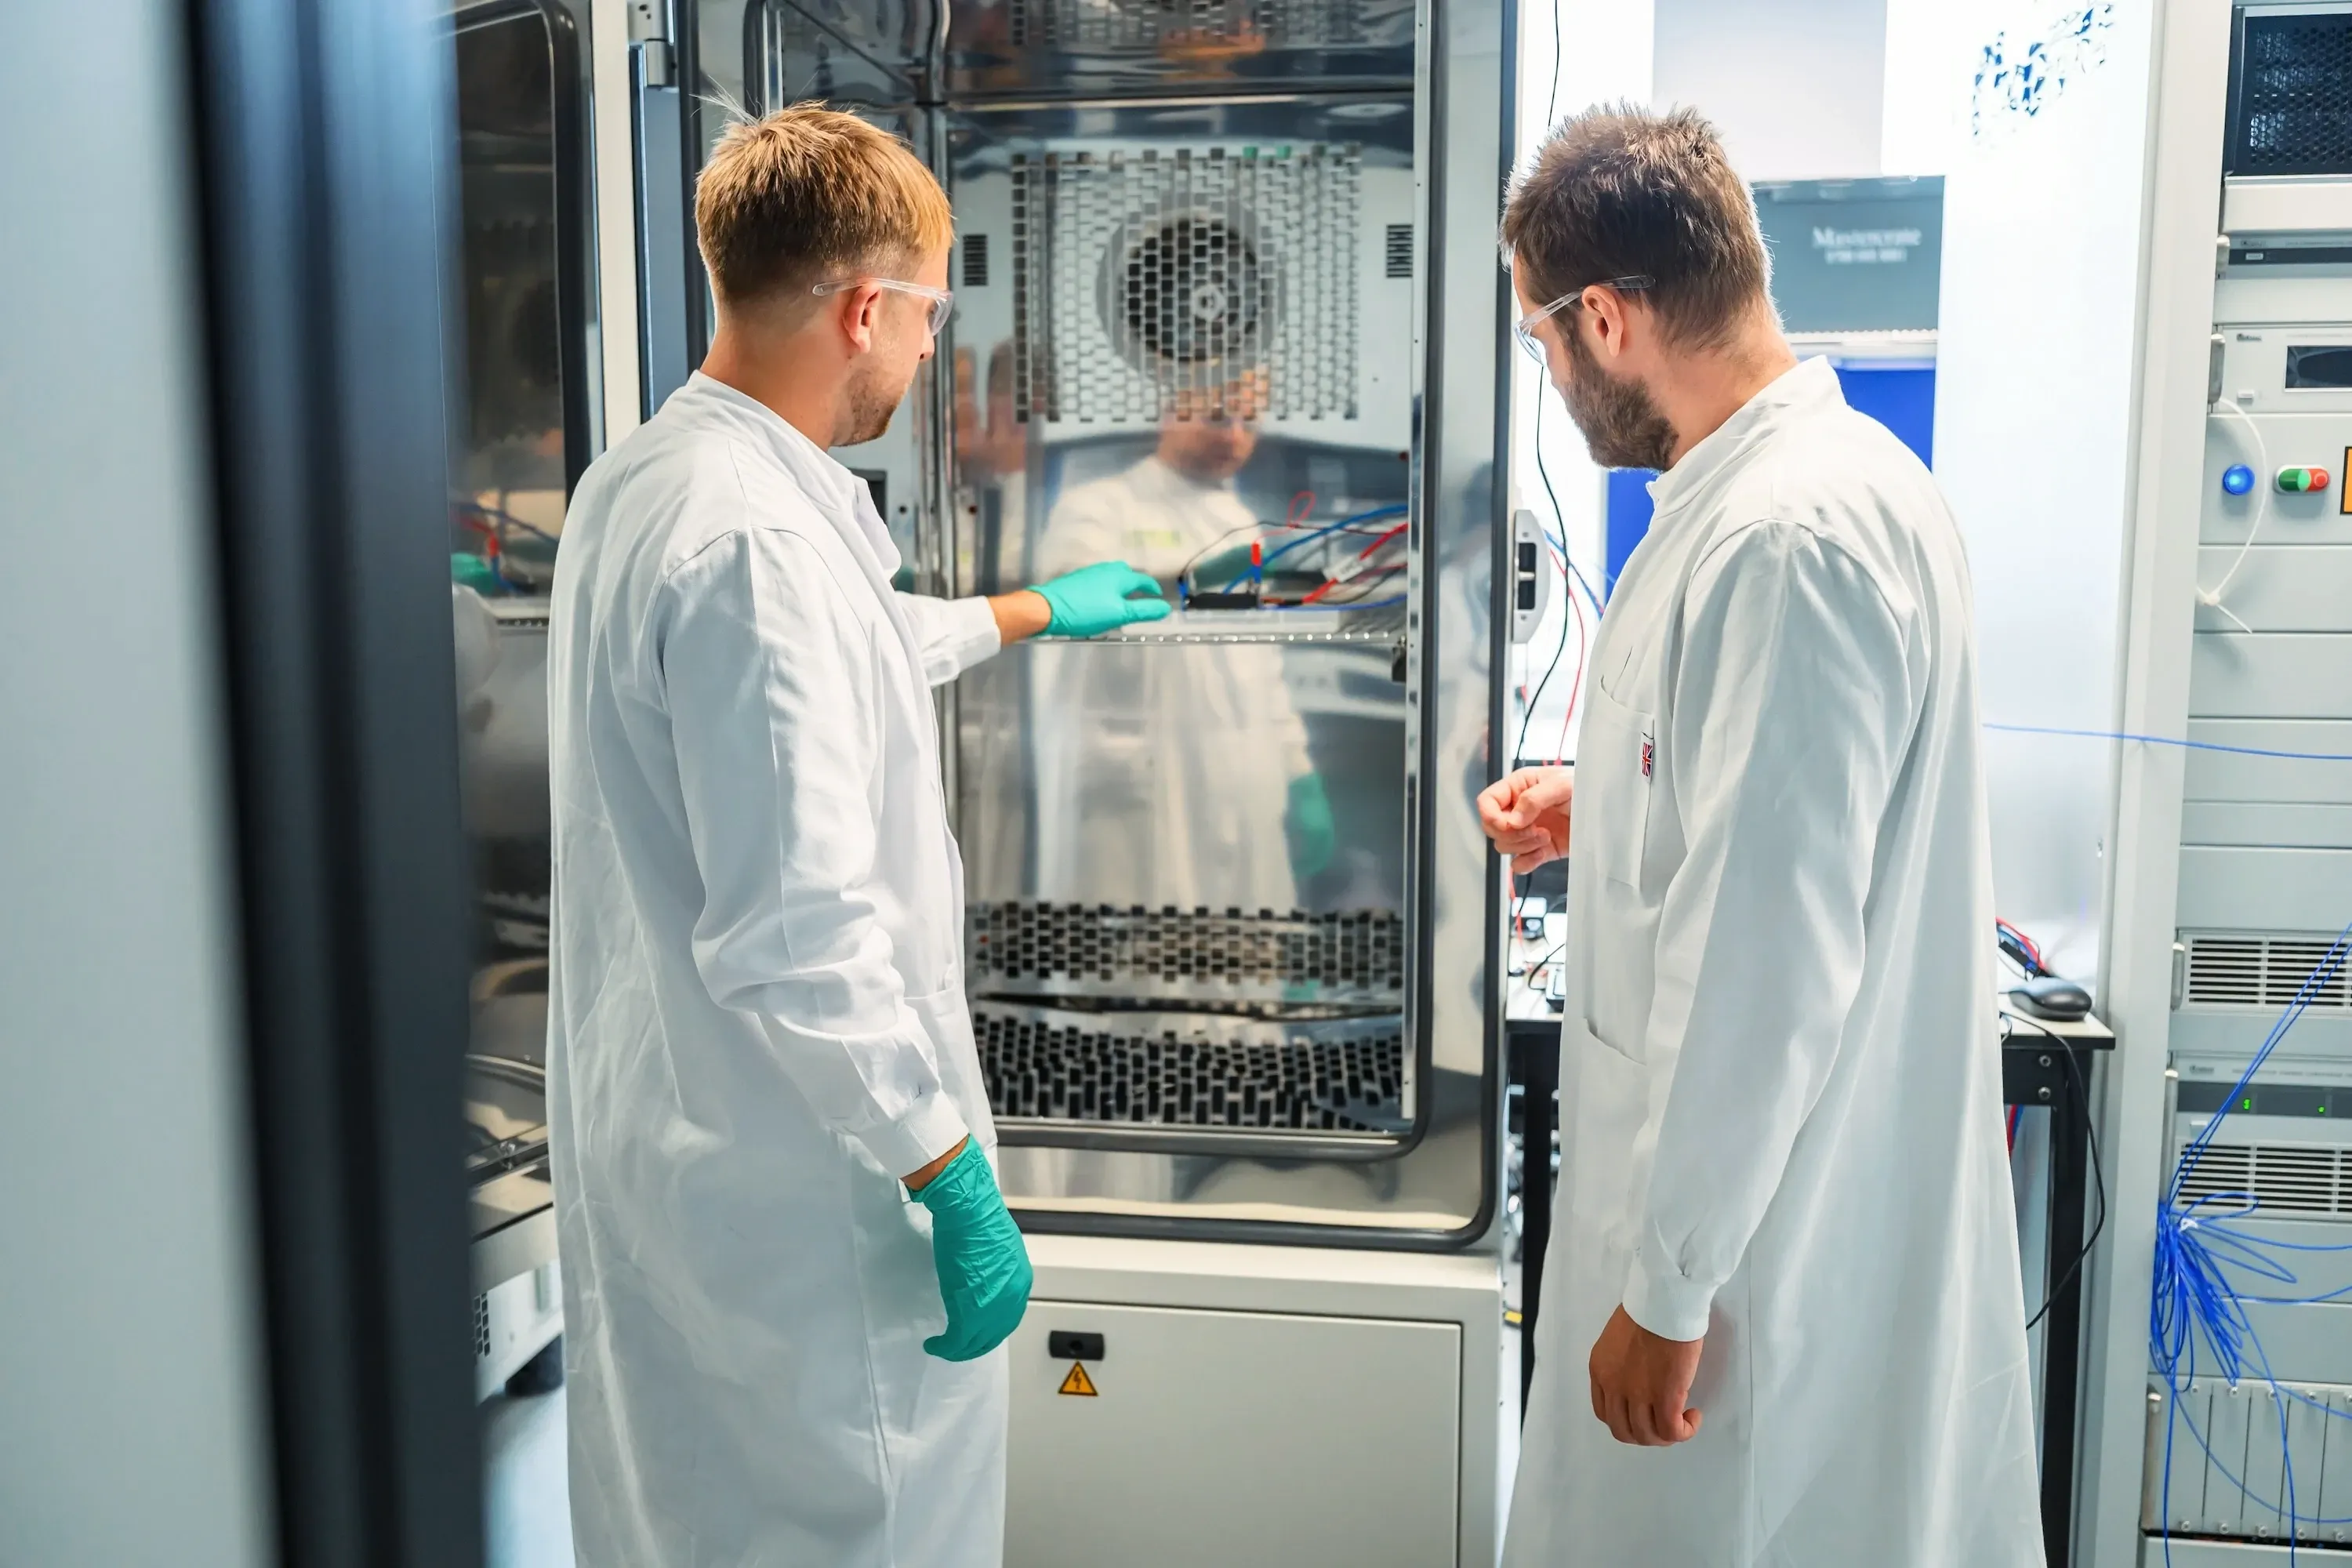
Across your test programme.
Formation
Compare acoustic activity during the first cycles across electrolytes, additives or electrode materials.
Ageing and cycling
Follow activity across long cycling programmes and compare how it changes as the cell ages.
Failure testing
In controlled abuse tests in the laboratory, acoustic activity gives another record of how and when a cell begins to fail.
Thousands of hits, sorted.
Each time the signal crosses a set threshold, the system records one acoustic hit and our AI classifies it in real time by its characteristics, so a long test becomes a set of classes you can count and compare between cells or conditions. The classes are a basis for comparison, not a claim about mechanism.
How hits are captured and classifiedThe visuals on this page are illustrative. They show how the monitoring works, not measured data from a particular cell.
Findings you can act on.
The synchronised record shows where acoustic activity changes while the electrochemical data stays flat, or where two conditions diverge. Each is marked as worth investigating, with what the evidence supports. Findings come with the test context, their limits and a suggested next experiment.
This is operando measurement: recorded in real time while the cell operates, synchronised with the electrochemical data and interpreted against it rather than in isolation.
Research you can read.
The approach is published. The papers most relevant to test programmes cover formation in sodium-ion cells, ageing in automotive pouch cells, the performance and safety of commercial cylindrical cells, and the machine learning that identifies gas evolution and particle cracking from acoustic emission.
Read the researchHow an R&D project starts.
One sensor on one test cell is enough to begin.
A technical call
A short call with the people who designed the experiment, to understand the cell, the fixture and the question behind the test.
A written scope
Which cells and conditions, which tests, how long, and what a useful result looks like.
A sensor on your cell
We fit a sensor to the cell in your fixture and check contact and background noise. A short calibration under your existing protocol gives the analysis its reference. Cells can be instrumented at your site or sent to us.
Findings, then the next experiment
Measurement during the agreed tests, then the synchronised record, the classified hits and findings with a suggested next experiment. As your questions grow, so can the setup.
Questions we're usually asked.
What do I need to try AcouBatt?
We can start with a single sensor on one test cell and scale the system as your research needs grow.
How are the sensors installed?
Sensors mount externally onto your test cells, whether they are tested on the bench or inside a battery cycler.
How is my data handled?
Your data can be processed and stored entirely on-premise, giving you full control over access. Secure cloud-based options are also available for hosted deployments.
Does AcouBatt fit our test protocol?
Yes. Following a short initial calibration, AcouBatt can integrate with your existing cell formats, cyclers and test protocols to begin generating usable insights.
Does the sensor send a signal into the cell?
No. The sensor is passive. It listens for emissions from inside the cell and sends nothing into it.
Tell us about your test programme.
The cell format, the fixture and the question you're trying to answer are enough to start. We'll tell you whether acoustic-emission monitoring is likely to add something and how it would fit your programme.
Tell us about your test programme